
Benchmark
This page gives every result of the benchmark I ran between Musonic Server and Navidrome, with the context you need to judge them. It is for anyone choosing a server, and for anyone who wants to check the numbers. How the test was run is on Benchmark method; the scripts and the raw results are on GitHub.
Key results
Section titled “Key results”| What | Musonic | Navidrome | Ratio |
|---|---|---|---|
| Scan of the whole library, from an empty database | 1.78 s | 18.9 s | 10.6× |
| Memory at rest, 60 s after the scan | 19.5 MiB | 100 MiB | 5.1× |
List every artist (getArtists, 797 artists), median |
0.429 ms | 52.7 ms | 122.9× |
Search “love” (search3), median |
0.353 ms | 29.4 ms | 83.4× |
| Slowest 5 % of the 14 everyday requests (p95), range | 0.361–3.56 ms | 1.34–84.6 ms | 2.3× to 146.6× |
| Requests per second with 64 concurrent clients | 913 | 156 | 5.8× |
| Server CPU time per 1,000 requests | 0.58–0.60 s | 11.0–12.1 s | 18.4× to 20.9× |
| First byte of a song transcoded for the first time | 42.0 ms | 33.5 ms | Navidrome 1.3× |
Navidrome is ahead on 12 of the 113 measures of the summary: the first transcoded byte, two size measures of covers, the throughput of an original file (by 6 %), the time to transcode a whole song (by 0.7 %), and the compressed size of 7 answers out of 14. They are all listed under Where Navidrome is ahead.
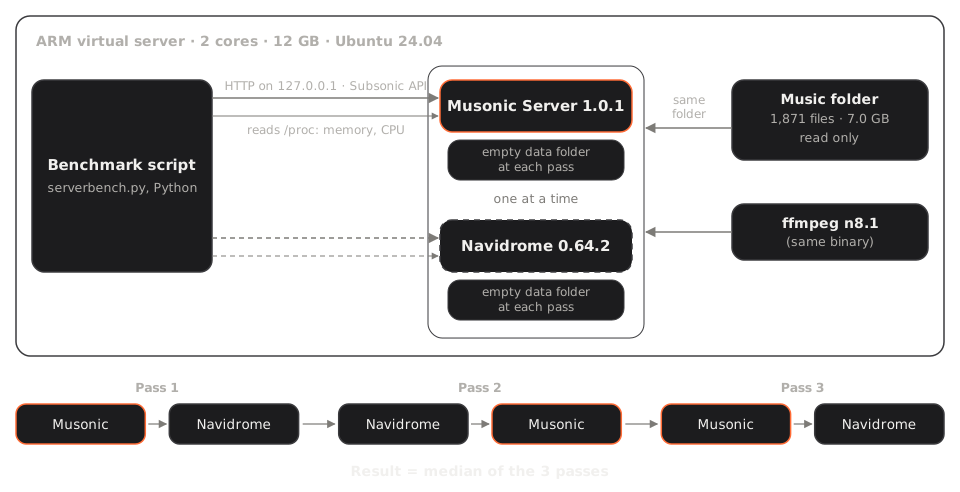
The setup: the test script (serverbench.py, in Python) runs on the same machine (Ubuntu 24.04) and talks to one server at a time over HTTP on 127.0.0.1, through the Subsonic API; it reads the server’s memory and CPU time in /proc. Both servers read the same music folder (read only) and use the same ffmpeg n8.1 binary. The order of the passes: Musonic then Navidrome, Navidrome then Musonic, Musonic then Navidrome.
How to read the tables
Section titled “How to read the tables”- Each value is the median of the 3 passes. The small numbers in brackets are the lowest and the highest of the 3 passes. No bracket means the 3 passes gave the same value at this precision.
- Ratio is always the better value divided by the worse one, so it is 1× or more. Ahead says which server has the better value; the better value is in bold.
- For times, memory, CPU time and sizes, lower is better. For requests per second and throughput, higher is better.
- Units: s (seconds), ms (milliseconds), MiB (1,048,576 bytes; Linux’s
/procgives memory in units of 1,024 bytes, divided here by 1,024), KiB (1,024 bytes), MB (1,000,000 bytes, for the data folder and the throughput). - A latency is measured by the client: from sending the request to receiving the whole answer, on a connection kept open, on the same machine. It includes the client’s own time.
Every result
Section titled “Every result”Library scan
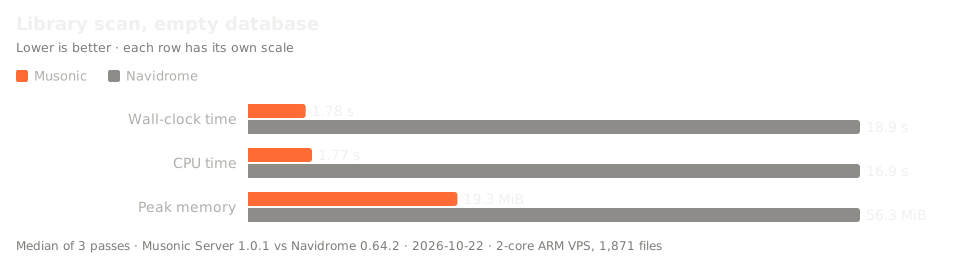
Section titled “Library scan”The time from the moment the server answers (and, for Musonic, its benchmark account is created) until its first full scan of the library is over, starting from an empty data folder. The CPU time is counted over the same span.
| Measure | Musonic | Navidrome | Ratio | Ahead |
|---|---|---|---|---|
| Wall-clock time (s) | 1.78 (1.77–2.01) | 18.9 (18.9–19.1) | 10.6× | Musonic |
| CPU time (s) | 1.77 (1.75–1.77) | 16.9 (16.6–17.0) | 9.6× | Musonic |
| Peak memory during the scan (MiB) | 19.3 (19.1–19.8) | 56.3 (55.7–61.4) | 2.9× | Musonic |
As a cross-check, the scan duration each server reports itself: Musonic 1.79 s (1.78–1.97), Navidrome 17.2 s (16.8–17.5), a ratio of 9.6×.
Memory
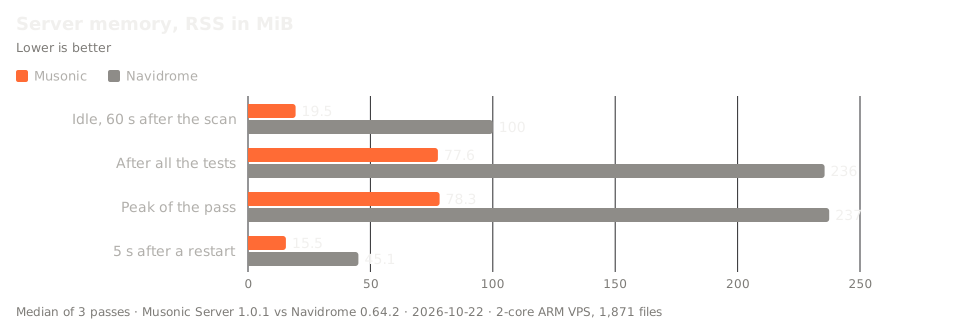
Section titled “Memory”Resident memory (RSS) of the server process.
| Measure | Musonic | Navidrome | Ratio | Ahead |
|---|---|---|---|---|
| Idle, 60 s after the scan | 19.5 (19.2–19.7) | 100 (94.9–109) | 5.1× | Musonic |
| After all the tests | 77.6 (72.4–79.2) | 236 (229–239) | 3.0× | Musonic |
| Peak over the whole pass (VmHWM) | 78.3 (72.8–79.5) | 237 (235–244) | 3.0× | Musonic |
| 5 s after a restart | 15.5 (15.4–15.5) | 45.1 (44.9–45.2) | 2.9× | Musonic |
Startup
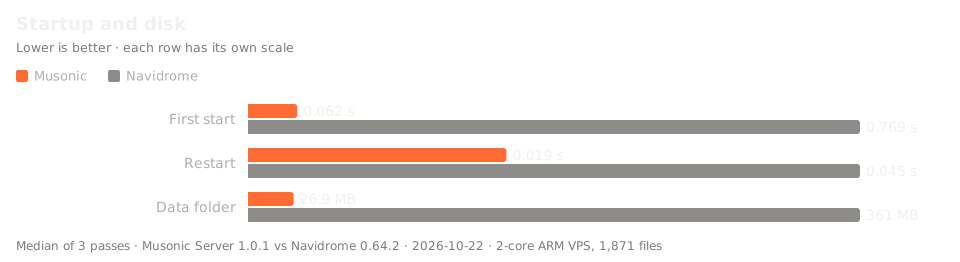
Section titled “Startup”The time from starting the program until it answers a first HTTP request.
| Measure | Musonic | Navidrome | Ratio | Ahead |
|---|---|---|---|---|
| First start, empty data folder (s) | 0.062 (0.055–0.147) | 0.769 (0.764–0.782) | 12.4× | Musonic |
| Restart, existing data folder (s) | 0.019 (0.018–0.029) | 0.045 (0.039–0.070) | 2.4× | Musonic |
Everything in the data folder after the pass: database, cover cache, transcoding cache and anything else the server wrote there. The test does not split it by kind.
| Measure | Musonic | Navidrome | Ratio | Ahead |
|---|---|---|---|---|
| Data folder after the pass (MB) | 26.9 (26.9–27.0) | 361 | 13.4× | Musonic |
Requests: median latency
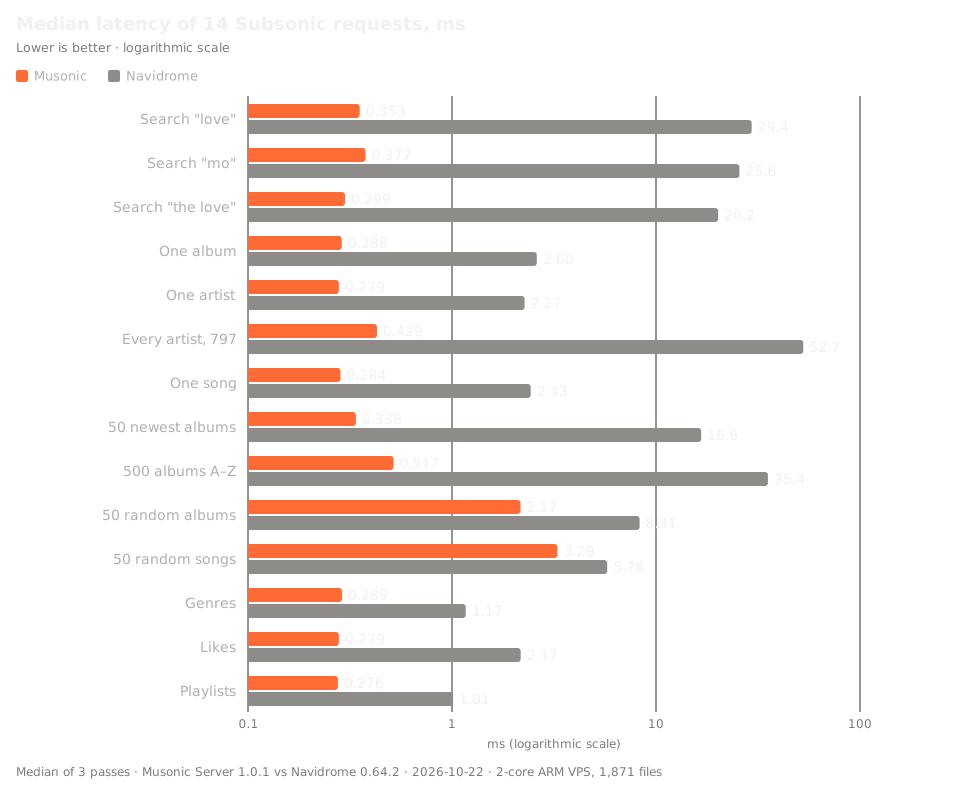
Section titled “Requests: median latency”The 14 Subsonic requests an app makes every day, each sent 20 times to warm up, then 200 times back to back. Median of the 200.
| Measure | Musonic | Navidrome | Ratio | Ahead |
|---|---|---|---|---|
Search “love” (search3) |
0.353 (0.336–0.355) | 29.4 (27.1–30.4) | 83.4× | Musonic |
Search “mo” (search3) |
0.377 (0.369–0.378) | 25.6 (24.4–28.1) | 68.0× | Musonic |
Search “the love” (search3) |
0.299 (0.296–0.329) | 20.2 (17.9–22.2) | 67.4× | Musonic |
One album (getAlbum) |
0.288 (0.285–0.293) | 2.60 (2.60–2.93) | 9.0× | Musonic |
One artist (getArtist) |
0.279 (0.278–0.392) | 2.27 (2.04–2.92) | 8.1× | Musonic |
Every artist, 797 (getArtists) |
0.429 (0.423–0.455) | 52.7 (51.8–53.3) | 122.9× | Musonic |
One song (getSong) |
0.284 (0.281–0.286) | 2.43 (2.00–2.44) | 8.6× | Musonic |
50 newest albums (getAlbumList2) |
0.338 (0.335–0.352) | 16.6 (16.5–17.0) | 49.3× | Musonic |
500 albums A–Z (getAlbumList2) |
0.517 (0.510–0.539) | 35.4 (35.3–35.4) | 68.4× | Musonic |
50 random albums (getAlbumList2) |
2.17 (2.13–2.21) | 8.31 (8.28–8.37) | 3.8× | Musonic |
50 random songs (getRandomSongs) |
3.29 (3.27–3.30) | 5.76 (5.70–5.90) | 1.8× | Musonic |
Genres (getGenres) |
0.289 (0.286–0.291) | 1.17 (1.14–1.18) | 4.0× | Musonic |
Likes (getStarred2) |
0.279 (0.277–0.282) | 2.17 (1.76–2.97) | 7.8× | Musonic |
Playlists (getPlaylists) |
0.276 (0.276–0.294) | 1.01 (0.994–1.05) | 3.7× | Musonic |
Requests: 95th percentile
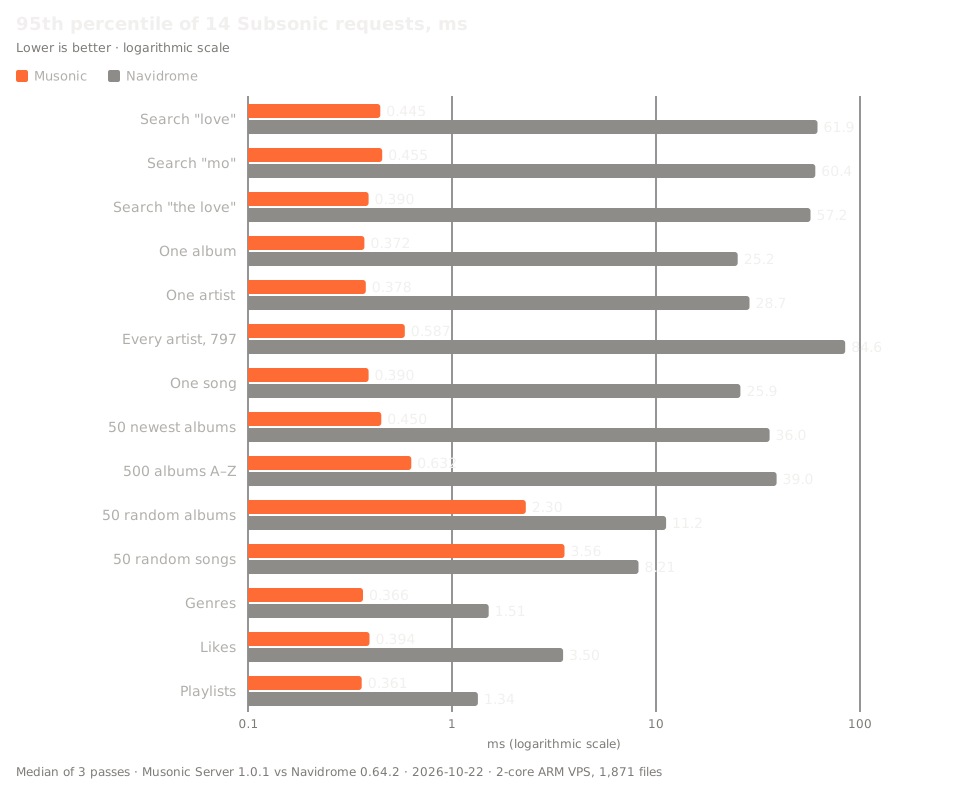
Section titled “Requests: 95th percentile”The same 200 requests: the time under which 95 % of them were answered (the slowest 5 % take longer).
| Measure | Musonic | Navidrome | Ratio | Ahead |
|---|---|---|---|---|
Search “love” (search3) |
0.445 (0.416–0.454) | 61.9 (60.7–62.4) | 139.1× | Musonic |
Search “mo” (search3) |
0.455 (0.450–0.493) | 60.4 (60.3–60.4) | 132.7× | Musonic |
Search “the love” (search3) |
0.390 (0.368–0.393) | 57.2 (57.1–57.2) | 146.6× | Musonic |
One album (getAlbum) |
0.372 (0.364–0.446) | 25.2 (21.9–29.7) | 67.6× | Musonic |
One artist (getArtist) |
0.378 (0.374–1.10) | 28.7 (26.0–34.2) | 76.0× | Musonic |
Every artist, 797 (getArtists) |
0.587 (0.511–0.832) | 84.6 (81.3–89.6) | 144.2× | Musonic |
One song (getSong) |
0.390 (0.362–0.539) | 25.9 (24.8–30.0) | 66.5× | Musonic |
50 newest albums (getAlbumList2) |
0.450 (0.415–0.456) | 36.0 (35.4–41.4) | 80.1× | Musonic |
500 albums A–Z (getAlbumList2) |
0.632 (0.597–0.640) | 39.0 (38.2–60.6) | 61.7× | Musonic |
50 random albums (getAlbumList2) |
2.30 (2.25–2.47) | 11.2 (11.0–11.4) | 4.9× | Musonic |
50 random songs (getRandomSongs) |
3.56 (3.47–4.79) | 8.21 (7.97–8.48) | 2.3× | Musonic |
Genres (getGenres) |
0.366 (0.363–0.370) | 1.51 (1.48–1.57) | 4.1× | Musonic |
Likes (getStarred2) |
0.394 (0.350–0.395) | 3.50 (3.36–3.94) | 8.9× | Musonic |
Playlists (getPlaylists) |
0.361 (0.355–0.753) | 1.34 (1.28–1.66) | 3.7× | Musonic |
Requests right after a like
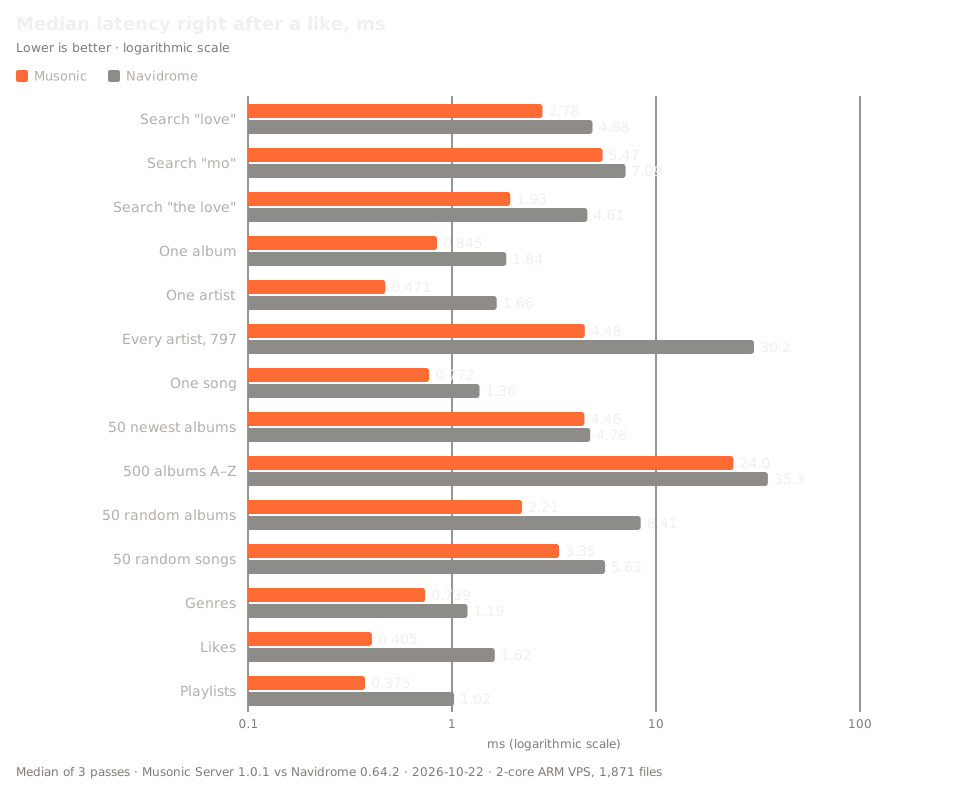
Section titled “Requests right after a like”Before each of the 200 measured requests, the client likes a song and removes the like (star, then unstar). It is the worst case for a server that keeps answers ready: Musonic 1.0.1 drops the answers a write changes and makes them again in the background, and here the next request arrives before that is done.
| Measure | Musonic | Navidrome | Ratio | Ahead |
|---|---|---|---|---|
Search “love” (search3) |
2.78 (2.64–2.80) | 4.88 (4.70–5.15) | 1.8× | Musonic |
Search “mo” (search3) |
5.47 (5.43–5.57) | 7.09 (6.71–7.12) | 1.3× | Musonic |
Search “the love” (search3) |
1.93 (1.92–1.94) | 4.61 (4.34–4.73) | 2.4× | Musonic |
One album (getAlbum) |
0.845 (0.837–0.853) | 1.84 (1.82–1.88) | 2.2× | Musonic |
One artist (getArtist) |
0.471 (0.470–0.483) | 1.66 (1.64–1.67) | 3.5× | Musonic |
Every artist, 797 (getArtists) |
4.48 (4.26–4.66) | 30.2 (30.2–30.3) | 6.8× | Musonic |
One song (getSong) |
0.772 (0.770–0.777) | 1.36 (1.36–1.37) | 1.8× | Musonic |
50 newest albums (getAlbumList2) |
4.46 (4.42–4.51) | 4.76 (4.72–4.79) | 1.07× | Musonic |
500 albums A–Z (getAlbumList2) |
24.0 (23.4–24.5) | 35.3 (35.2–35.4) | 1.5× | Musonic |
50 random albums (getAlbumList2) |
2.21 (2.20–2.25) | 8.41 (8.37–8.65) | 3.8× | Musonic |
50 random songs (getRandomSongs) |
3.35 (3.27–3.42) | 5.63 (5.54–5.67) | 1.7× | Musonic |
Genres (getGenres) |
0.739 (0.735–0.740) | 1.19 (1.18–1.20) | 1.6× | Musonic |
Likes (getStarred2) |
0.405 (0.391–0.414) | 1.62 (1.62–1.70) | 4.0× | Musonic |
Playlists (getPlaylists) |
0.375 (0.365–0.377) | 1.02 (1.00–1.03) | 2.7× | Musonic |
Requests 300 ms after a like
Section titled “Requests 300 ms after a like”The same like and removal, then a wait of 300 ms before the request, like a person who opens the next screen. 30 measured requests per route instead of 200.
| Measure | Musonic | Navidrome | Ratio | Ahead |
|---|---|---|---|---|
Search “love” (search3) |
0.694 (0.690–0.706) | 7.21 (6.86–7.58) | 10.4× | Musonic |
Search “mo” (search3) |
0.708 (0.707–0.712) | 9.47 (9.24–9.56) | 13.4× | Musonic |
Search “the love” (search3) |
0.683 (0.678–0.689) | 6.94 (6.82–6.98) | 10.2× | Musonic |
One album (getAlbum) |
0.671 (0.670–0.680) | 2.42 (2.42–2.50) | 3.6× | Musonic |
One artist (getArtist) |
0.665 (0.665–0.672) | 2.22 (2.21–2.26) | 3.3× | Musonic |
Every artist, 797 (getArtists) |
0.728 (0.723–0.731) | 30.2 (30.0–30.8) | 41.5× | Musonic |
One song (getSong) |
0.678 (0.672–0.678) | 1.91 | 2.8× | Musonic |
50 newest albums (getAlbumList2) |
0.699 (0.692–0.700) | 5.14 (5.10–5.18) | 7.4× | Musonic |
500 albums A–Z (getAlbumList2) |
0.762 (0.752–0.802) | 35.4 (35.3–35.5) | 46.5× | Musonic |
50 random albums (getAlbumList2) |
3.25 (3.25–3.27) | 8.90 (8.85–8.95) | 2.7× | Musonic |
50 random songs (getRandomSongs) |
4.64 (4.63–4.67) | 6.01 (6.00–6.14) | 1.3× | Musonic |
Genres (getGenres) |
0.672 (0.664–0.673) | 1.66 (1.65–1.66) | 2.5× | Musonic |
Likes (getStarred2) |
0.670 (0.665–0.674) | 3.63 (3.63–3.66) | 5.4× | Musonic |
Playlists (getPlaylists) |
0.675 (0.670–0.675) | 1.50 (1.50–1.54) | 2.2× | Musonic |
Concurrent clients: throughput
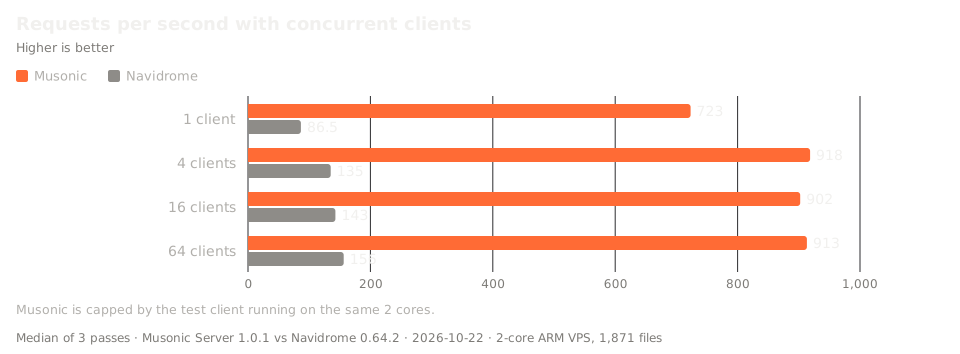
Section titled “Concurrent clients: throughput”1, 4, 16 and 64 clients at once for 10 s each, every client on its own connection, picking each request at random among: one album, the 50 newest albums, a search for a random word, every artist, 20 random songs.
| Measure | Musonic | Navidrome | Ratio | Ahead |
|---|---|---|---|---|
| 1 client (requests/s) | 723 (723–729) | 86.5 (86.1–87.1) | 8.4× | Musonic |
| 4 clients (requests/s) | 918 (899–928) | 135 (134–136) | 6.8× | Musonic |
| 16 clients (requests/s) | 902 (900–905) | 143 (141–143) | 6.3× | Musonic |
| 64 clients (requests/s) | 913 (904–917) | 156 (152–158) | 5.8× | Musonic |
Concurrent clients: latency
Section titled “Concurrent clients: latency”The latency of every request made during those 10 s steps (median and 95th percentile).
| Measure | Musonic | Navidrome | Ratio | Ahead |
|---|---|---|---|---|
| 1 client: median (ms) | 0.410 (0.410–0.420) | 5.68 (5.67–5.68) | 13.9× | Musonic |
| 1 client: p95 (ms) | 2.53 (2.47–2.53) | 32.9 (32.9–33.0) | 13.0× | Musonic |
| 4 clients: median (ms) | 2.44 (2.42–2.48) | 19.0 (18.6–19.0) | 7.8× | Musonic |
| 4 clients: p95 (ms) | 6.32 (6.27–6.55) | 80.7 (79.1–81.0) | 12.8× | Musonic |
| 16 clients: median (ms) | 9.23 (9.22–9.24) | 102 (100–103) | 11.0× | Musonic |
| 16 clients: p95 (ms) | 23.9 (23.8–24.9) | 212 (210–212) | 8.9× | Musonic |
| 64 clients: median (ms) | 33.5 (33.0–33.7) | 394 (381–399) | 11.8× | Musonic |
| 64 clients: p95 (ms) | 105 (104–106) | 593 (583–624) | 5.6× | Musonic |
Server CPU time
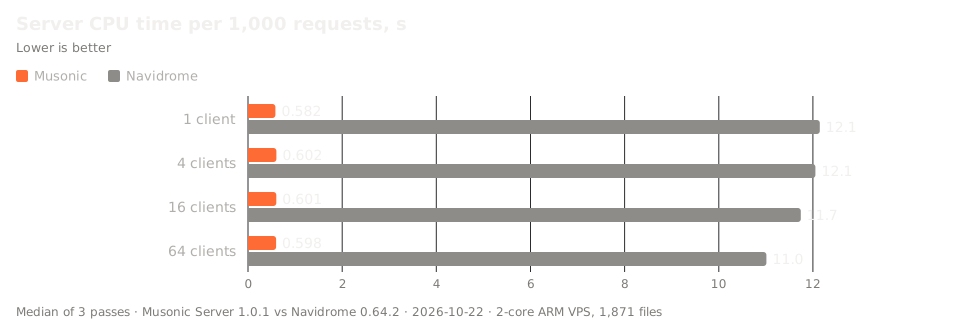
Section titled “Server CPU time”CPU time used by the server process (user and system, read from /proc) during each 10 s step, divided by the number of requests it answered, for 1,000 requests.
| Measure | Musonic | Navidrome | Ratio | Ahead |
|---|---|---|---|---|
| 1 client (s) | 0.582 (0.576–0.585) | 12.1 (12.1–12.2) | 20.9× | Musonic |
| 4 clients (s) | 0.602 (0.600–0.603) | 12.1 (12.0–12.2) | 20.0× | Musonic |
| 16 clients (s) | 0.601 (0.596–0.602) | 11.7 (11.7–11.8) | 19.5× | Musonic |
| 64 clients (s) | 0.598 (0.589–0.600) | 11.0 (10.8–11.1) | 18.4× | Musonic |
The same CPU time per second of the step, which shows how much of the 2 cores each server used (2.0 would be both cores full):
| Measure | Musonic | Navidrome | Ratio | Ahead |
|---|---|---|---|---|
| 1 client (CPU s per s) | 0.421 (0.420–0.423) | 1.06 (1.04–1.06) | 2.5× | Musonic |
| 4 clients (CPU s per s) | 0.554 (0.540–0.559) | 1.63 (1.62–1.63) | 2.9× | Musonic |
| 16 clients (CPU s per s) | 0.542 (0.537–0.545) | 1.67 (1.66–1.68) | 3.1× | Musonic |
| 64 clients (CPU s per s) | 0.542 (0.538–0.548) | 1.70 (1.69–1.72) | 3.1× | Musonic |
Covers
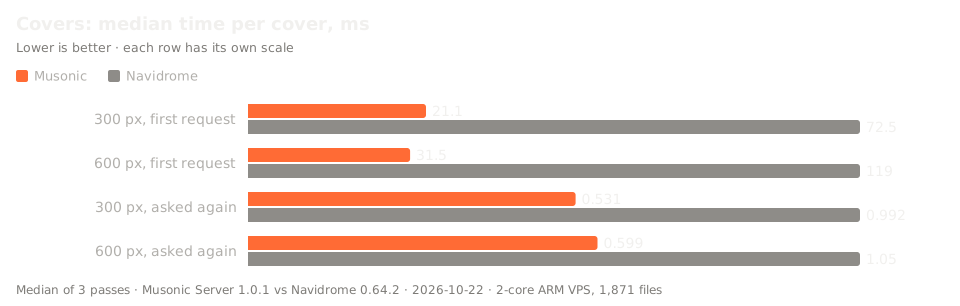
Section titled “Covers”The covers of 60 albums, asked at 300 and 600 pixels: a first time (the server resizes the picture), again at once, then again 10 s later. Times are the median of the 60 requests.
| Measure | Musonic | Navidrome | Ratio | Ahead |
|---|---|---|---|---|
| 300 px, first request (median ms) | 21.1 (21.0–21.7) | 72.5 (72.1–72.8) | 3.4× | Musonic |
| 300 px, asked again at once (median ms) | 0.531 (0.516–0.537) | 0.992 (0.983–1.15) | 1.9× | Musonic |
| 300 px, asked again 10 s later (median ms) | 0.539 (0.537–0.540) | 0.921 (0.911–0.929) | 1.7× | Musonic |
| 600 px, first request (median ms) | 31.5 (30.1–32.6) | 119 (115–119) | 3.8× | Musonic |
| 600 px, asked again at once (median ms) | 0.599 (0.596–0.643) | 1.05 (1.02–1.05) | 1.8× | Musonic |
| 600 px, asked again 10 s later (median ms) | 0.637 (0.605–0.637) | 0.977 (0.956–0.978) | 1.5× | Musonic |
Total size of the 60 covers received:
| Measure | Musonic | Navidrome | Ratio | Ahead |
|---|---|---|---|---|
| 300 px, first request (KiB, 60 covers) | 1,091 | 1,001 | 1.09× | Navidrome |
| 300 px, asked again at once (KiB) ¹ | 973 (962–979) | 1,001 | 1.03× | Musonic |
| 300 px, 10 s later (KiB) | 915 (906–919) | 1,001 | 1.09× | Musonic |
| 600 px, first request (KiB, 60 covers) | 3,701 | 3,488 | 1.06× | Navidrome |
| 600 px, asked again at once (KiB) ¹ | 3,440 | 3,488 | 1.01× | Musonic |
| 600 px, 10 s later (KiB) | 3,246 (3,222–3,249) | 3,488 | 1.07× | Musonic |
¹ Not in the summary file: computed from the raw results in the same way.
Musonic 1.0.1 sends a first version of a resized cover at once, then makes a smaller one in the background (mozjpeg) that replaces it in its cache. That is why its sizes go down between the first request and 10 s later, while Navidrome’s stay the same.
Streaming
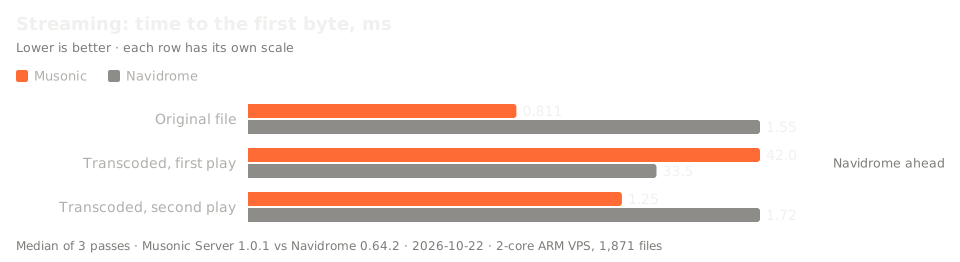
Section titled “Streaming”The same 10 audio files on both servers (found by their size in bytes), each read once before the measures so that the system’s disk cache does not decide. 5 files are sent as they are; 5 others, at 128 kbit/s, are transcoded to MP3 at 96 kbit/s by the same ffmpeg for both servers.
| Measure | Musonic | Navidrome | Ratio | Ahead |
|---|---|---|---|---|
| First byte, original file (ms) | 0.811 (0.808–0.838) | 1.55 (1.43–1.61) | 1.9× | Musonic |
| Whole original file, throughput (MB/s) | 625 (616–660) | 660 (631–720) | 1.06× | Navidrome |
| First byte, transcoded to MP3 96 kbit/s, first play (ms) | 42.0 (41.9–42.1) | 33.5 (33.4–40.4) | 1.3× | Navidrome |
| Whole song transcoded, first play (ms) | 2,779 (2,761–2,784) | 2,760 (2,758–2,761) | 1.01× | Navidrome |
| First byte, transcoded, second play (ms) | 1.25 (1.20–1.36) | 1.72 (1.71–1.72) | 1.4× | Musonic |
Sign-in on each request
Section titled “Sign-in on each request”A Subsonic app signs in on every request. ping does nothing else, so it shows the cost of the sign-in plus the floor of the measure (client, connection).
| Measure | Musonic | Navidrome | Ratio | Ahead |
|---|---|---|---|---|
ping, token sign-in t+s (median ms) |
0.270 (0.269–0.271) | 0.682 (0.651–0.698) | 2.5× | Musonic |
ping, password p (median ms) |
0.395 (0.377–0.396) | 0.705 (0.664–0.719) | 1.8× | Musonic |
Answer size
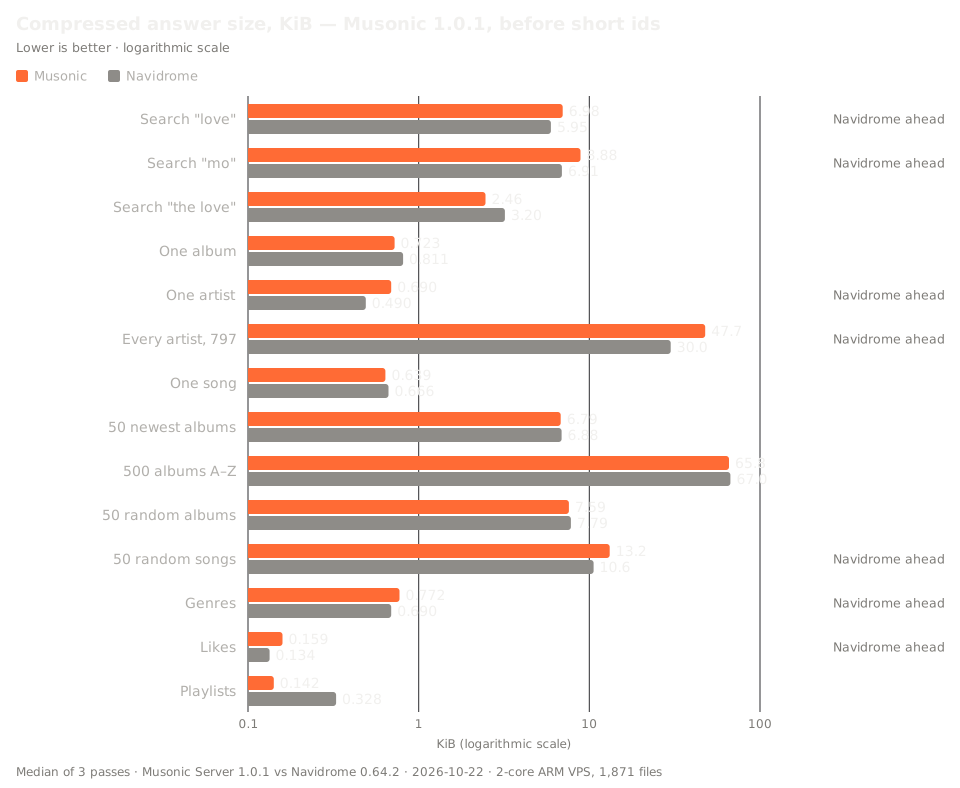
Section titled “Answer size”Size of each answer as received with Accept-Encoding: gzip (one request per route), in KiB.
| Measure | Musonic | Navidrome | Ratio | Ahead |
|---|---|---|---|---|
Search “love” (search3) |
6.98 (6.96–7.00) | 5.95 | 1.2× | Navidrome |
Search “mo” (search3) |
8.88 (8.84–8.90) | 6.91 (6.90–6.92) | 1.3× | Navidrome |
Search “the love” (search3) |
2.46 (2.45–2.47) | 3.20 | 1.3× | Musonic |
One album (getAlbum) |
0.723 (0.723–0.726) | 0.811 (0.808–0.812) | 1.1× | Musonic |
One artist (getArtist) |
0.690 | 0.490 (0.489–0.490) | 1.4× | Navidrome |
Every artist, 797 (getArtists) |
47.7 | 30.0 (30.0–30.1) | 1.6× | Navidrome |
One song (getSong) |
0.639 (0.639–0.640) | 0.666 (0.666–0.670) | 1.04× | Musonic |
50 newest albums (getAlbumList2) |
6.79 (6.70–6.85) | 6.88 | 1.01× | Musonic |
500 albums A–Z (getAlbumList2) |
65.8 (65.7–65.8) | 67.0 (67.0–67.1) | 1.02× | Musonic |
50 random albums (getAlbumList2) |
7.59 (7.37–7.64) | 7.79 (7.58–7.91) | 1.03× | Musonic |
50 random songs (getRandomSongs) |
13.2 (12.4–13.2) | 10.6 (10.5–11.2) | 1.2× | Navidrome |
Genres (getGenres) |
0.772 (0.772–0.773) | 0.690 | 1.1× | Navidrome |
Likes (getStarred2) |
0.159 | 0.134 | 1.2× | Navidrome |
Playlists (getPlaylists) |
0.142 | 0.328 (0.326–0.331) | 2.3× | Musonic |
For reference, the size of the same answers without compression (the latency tests above use uncompressed answers), in KiB:
| Measure | Musonic | Navidrome | Ratio | Ahead |
|---|---|---|---|---|
Search “love” (search3) |
25.9 (25.9–26.0) | 30.8 | 1.2× | Musonic |
Search “mo” (search3) |
33.0 (33.0–33.2) | 36.5 | 1.1× | Musonic |
Search “the love” (search3) |
8.65 | 15.0 | 1.7× | Musonic |
One album (getAlbum) |
1.79 | 1.98 | 1.1× | Musonic |
One artist (getArtist) |
0.690 | 0.894 | 1.3× | Musonic |
Every artist, 797 (getArtists) |
104 | 125 | 1.2× | Musonic |
One song (getSong) |
1.26 | 1.34 | 1.06× | Musonic |
50 newest albums (getAlbumList2) |
23.1 | 31.6 | 1.4× | Musonic |
500 albums A–Z (getAlbumList2) |
235 | 323 | 1.4× | Musonic |
50 random albums (getAlbumList2) |
23.9 (23.7–23.9) | 32.2 (32.0–33.0) | 1.3× | Musonic |
50 random songs (getRandomSongs) |
47.7 (47.2–47.8) | 54.1 (53.6–54.2) | 1.1× | Musonic |
Genres (getGenres) |
2.49 | 2.72 | 1.09× | Musonic |
Likes (getStarred2) |
0.159 | 0.142 | 1.1× | Navidrome |
Playlists (getPlaylists) |
0.142 | 0.475 | 3.4× | Musonic |
Musonic’s getArtist, getStarred2 and getPlaylists answers have the same size with and without gzip: Musonic 1.0.1 sent these small answers (under 1 KiB) uncompressed.
Where Navidrome is ahead
Section titled “Where Navidrome is ahead”Every measure of the summary where Navidrome has the better value:
| Measure | Musonic | Navidrome | Navidrome ahead by |
|---|---|---|---|
| First byte of a song transcoded for the first time | 42.0 ms | 33.5 ms | 1.25× |
| Whole original file, throughput | 625 MB/s | 660 MB/s | 1.06× |
| Whole song transcoded, first play | 2,779 ms | 2,760 ms | 1.007× |
| 60 covers at 300 px, first request, total size | 1,091 KiB | 1,001 KiB | 1.09× |
| 60 covers at 600 px, first request, total size | 3,701 KiB | 3,488 KiB | 1.06× |
Every artist (getArtists), compressed |
47.7 KiB | 30.0 KiB | 1.59× |
One artist (getArtist), compressed |
0.690 KiB | 0.490 KiB | 1.41× |
Search “mo” (search3), compressed |
8.88 KiB | 6.91 KiB | 1.29× |
50 random songs (getRandomSongs), compressed |
13.2 KiB | 10.6 KiB | 1.24× |
Likes (getStarred2), compressed |
0.159 KiB | 0.134 KiB | 1.19× |
Search “love” (search3), compressed |
6.98 KiB | 5.95 KiB | 1.17× |
Genres (getGenres), compressed |
0.772 KiB | 0.690 KiB | 1.12× |
What they mean:
- First transcoded byte (33.5 against 42.0 ms). This is the delay before a song starts when the server has to convert it and has never converted it before. Once converted, Musonic keeps the result on disk, and a second play starts in 1.25 ms against 1.72 ms. Since 1.0.1, when an app saves its play queue on the server (
savePlayQueue), Musonic also converts the next song in the background before its turn; the benchmark does not save a queue, so this is not measured. - Compressed size of artists and searches. In 1.0.1, Musonic’s ids were 36-character UUIDs, which do not compress; Navidrome’s are 22 characters. The list of every artist was 47.7 KiB against 30.0 KiB. Short ids came in Musonic Server 1.0.3 (see What changed since).
- Covers at the very first request are 6 to 9 % heavier with Musonic, then 7 to 9 % lighter 10 s later, once the background version replaced them.
- Throughput of an original file (625 against 660 MB/s) and the time to transcode a whole song (2,779 against 2,760 ms) differ by 6 % and 0.7 %; the ranges of the passes overlap for the throughput (616–660 against 631–720 MB/s).
About the single average number
Section titled “About the single average number”The previous version of this site showed “6.9× on average, over 36 measures”. Here is where it comes from, and why this page does not use one number as its headline.
- It is the geometric mean of 36 ratios, each written as “how many times better Musonic is” (Navidrome ÷ Musonic for times, memory and sizes; Musonic ÷ Navidrome for throughput), so a measure where Navidrome is ahead counts as a value below 1. The geometric mean is the n-th root of the product of the n ratios, the usual way to average speed-ups.
- The 36 measures were: the 9 of scan, memory, startup and disk; the 14 median latencies; the 4 throughputs and the CPU time per 1,000 requests; and 8 of covers and playback (first cover at 300 and 600 px, cover asked again at 300 px, first byte of an original file, first transcoded byte, transcoded second play,
pingwith a token, throughput of an original file). - Recomputed from the raw results with unrounded medians, it is 6.95. The 6.9 shown before came from rounded values (for example 11.7 s ÷ 0.6 s for the CPU time).
- The same mean over all 113 measures of the summary (with the p95, the “after a like” series, the latency under load and every size) is 5.14.
- An average depends on which measures you put in it, and it hides the measures where Navidrome is ahead. Read the tables above for what matters to you.
What this benchmark does NOT show
Section titled “What this benchmark does NOT show”- A large library. 1,871 files, 7.0 GB, 797 artists, about 1,000 albums: a small library. Nothing here says how either server behaves with 30,000 or 100,000 songs. That test is planned (see Benchmark method).
- Other hardware. One ARM virtual server with 2 cores and 12 GB of memory. Not a Raspberry Pi, not an x86 machine, not a NAS, not a hard disk.
- A quiet machine. Other services were running on the same server during the run, for both servers alike.
- A separate load generator. The test client runs on the same 2 cores as the server. It caps Musonic at about 900 requests per second, and its own time is inside every latency: Musonic’s sub-millisecond medians are close to the floor of the measure (
pingtakes 0.270 ms). - Tuned settings. Navidrome ran with its default settings, except that its scheduled scan, external services, Last.fm and usage statistics were turned off. Musonic ran with its defaults, except that its online catalogue, previews, imports and update check were turned off. Neither server was tuned for this test.
- Several dates or machines. One run, on one evening, on one machine. The 3 passes show how stable the numbers are on that machine, not on another.
- The apps. This is a server test. It says nothing about the Musonic apps, the Subsonic apps or the network between them and the server.
- Features. It compares speed and resources on the same Subsonic requests, not what each server can do.
- Rescans. Only the first full scan of an empty database was measured, not a rescan after a few files changed.
- Today’s versions. See below.
What changed since
Section titled “What changed since”The measures are for Musonic Server 1.0.1 and Navidrome 0.64.2. Both have changed since; the benchmark has not been run again.
- Short ids (Musonic Server 1.0.3): songs, albums, artists, folders and playlists now have 11-character ids instead of 36. According to the 1.0.3 changelog, this makes the list of artists 42 % lighter, 500 albums 24 % and a search about 20 %. These are Musonic-only figures, not measured against Navidrome: the compressed sizes on this page are those of 1.0.1, and today’s Musonic answers are smaller.
/health(Musonic Server 1.0.3) no longer reports the scan. The script now falls back to the SubsonicgetScanStatusroute, so it works with current versions (see the script’s README).- The current version of Musonic Server is 1.2.1. Navidrome has its own releases after 0.64.2. Neither has been measured since 2026-10-22.
Check it yourself
Section titled “Check it yourself”The scripts (serverbench.py, summarize.py), the configuration used and the raw results of this run (results/2026-10-22-v6/) are in the repository. You can run the same test on your machine, with your library.